Introduction to the Dashboards
In both Invicti Enterprise and Invicti Standard, the dashboards enable you to view scan results, vulnerabilities, issues, statistics and other information from a single window, both while scans are running and once they are completed.
Viewing the global dashboard in Invicti Enterprise
The Invicti Enterprise global dashboard provides you with an overview of the security status of all Website Groups and Websites in your Invicti Enterprise account.
In the panel at the top of the window, you can see the following:
- USERS displays the number of current and active users on your account in the last week
- WEBSITES displays the number of websites on your account
- COMPLETED SCANS displays the number of finished scans
- ACTIVE ISSUES displays the number of Issues that remain unresolved
- WEBSITE GROUP DROP-DOWN displays the security status of all your websites or certain groups only. The options are All Websites, Default, and Your Website Groups.
- DATE RANGE lets you filter the information visible on the global dashboard based on the date range you selected. The default range is three months. The date range affects Severity Trend, Issues, Security Overview, Average Time to Fix, and Fixed Issues information.
For further information, see Global Dashboard Panels.
Global dashboard panels
This table lists and explains the panels on the global dashboard page.
| Panel | Description |
| Severity Trend | This chart displays the increase or decrease of each Vulnerability Severity Level over time. |
| Severities | This doughnut chart displays the number of vulnerabilities found, grouped by Vulnerability Severity Level, in proportion to the total detected. For further information, see Vulnerability Severity Levels. |
| Issues | This clustered column chart shows the number of Issues found, grouped by Vulnerability Severity Level. For further information, see Viewing Issues in Invicti Enterprise. |
| Security Overview | This doughnut chart displays the total number of Critical and Insecure issues. |
| Average Time to Fix | This is a column chart that displays the average length of time it takes for Issues to be fixed, grouped by Vulnerability Severity Level. It is visible to all global dashboard users but hidden if there are no fixed issues in the target account. |
| Fixed Issues | This is a column chart that displays the number of Issues that have been fixed in each Vulnerability Severity Level. |
| Next Scheduled Scans | This is a panel that displays a list of Scheduled Scans. For further information, see Scheduling Scans. |
| Recent Scans | This panel displays a list of Recent Scans. Hover the mouse over various icons to see what types and numbers of Vulnerabilities have been detected. Further options include: Incremental Scans Retest |
| Latest To Do Issues | This panel displays the latest detected Issues, with an icon indicating their Vulnerability Severity Level. |
| Websites That Have Shortest Fix Time | This panel displays websites and estimates the required time to fix all issues identified in the website. Further options include: Scan Incremental Scans Retest Scheduled Scan |
| Most Identified Technologies | This panel provides details of the versions of the most common identified technologies. |
How to view the global dashboard in Invicti Enterprise
The global dashboard is displayed, by default, as soon as you log in. Alternatively, from the main menu, select Websites > Dashboard. The Global Dashboard is displayed.

For further information, see Global Dashboard Panels above.
Viewing the website dashboard in Invicti Enterprise
The Website Dashboard lets you view the results of the latest security scan for a single website – while the scan is running and once it has been completed.
You can also choose to view other completed security scans with different configurations, such as those with the same Scan Policy and Scan Settings, from the drop-down menu.
In the panel at the top of the window, you can see the following:
- [NAME OF WEBSITE] displays the name of the website with a Launch a Scan button
- ISSUES displays the number (if any) of issues detected on a particular website since the last scan
- SCHEDULED SCAN displays information of any scheduled scans, along with a Schedule a scan button
- LATEST REPORT has a Report button
- SCAN GROUP drop-down menu displays the security status of an individual website, grouped by Scan Groups.
Website dashboard panels
This table lists and explains the panels on the Scan Summary Dashboard page.
| Panel | Description |
| Severity Trend | This chart displays the increase or decrease of each Vulnerability Severity Level over time. Select Trend Matrix Report (Severity Trend Report) for a more comprehensive overview. The Trend Matrix Report is generated only if you run more than one scan. |
| Severities | This doughnut chart displays the number of vulnerabilities found, grouped by Vulnerability Severity Level, in proportion to the total detected. For further information, see Vulnerability Severity Levels. |
| Issues | This clustered column chart shows the number of Issues found, grouped by Vulnerability Severity Level. For further information, see Viewing Issues in Invicti Enterprise. |
| Security Overview | This doughnut chart displays the total number of Critical and Insecure Issues. |
| Average Time to Fix | This is a column chart that displays how long it takes for Issues to be fixed on average, grouped by Vulnerability Severity Level. |
| Fixed Issues | This is a column chart that displays the number of Issues that have been fixed in each Vulnerability Severity Level. |
| Issues | This is a list of all the issues detected in the scan. |
| Relevant Notifications | This is a list of all Notifications for the scan, including: Name Event Email Recipients SMS Recipients |
| Website Name | This panel lists the website’s name and group. Further options include: Select More to view Issues, Scans, or Scheduled Scans Select Edit to edit the website Select Delete to delete it. When you delete a website, there is no way to bring it or its data back. |
| Recent Scans | This displays a list of Recent Scans. Hover the mouse over various icons to see what types of Vulnerabilities have been detected. Further options include: Scan Incremental Scans Retest Scheduled Scan |
| License Status | This panel contains the subscription expiry date. |
| Most Identified Technologies | This panel provides details of the versions of the most common identified technologies. |
| Technologies | This is the number of detected technologies, including out-of-date ones, and issues. |
How to view the website dashboard in Invicti Enterprise
- Log in to Invicti Enterprise.
- From the main menu, select Websites > Websites.
- Select any Name of any websites listed on the Websites page.

For further information, see Website Dashboard Panels.
Viewing the welcome dashboard in Invicti Standard
When you open Invicti Standard, the Welcome Dashboard is displayed and the Start a New Website or Web Service Scan dialog opens. Close the dialog to view the following areas in the window.
The Welcome page also contains links to Updates, the latest articles in our Web Application Security Blog, as well as Support and Resources links.

For further information on menus and ribbons, see Navigation in Invicti Standard.
Viewing the scan summary dashboard in Invicti Standard
The Scan Summary Dashboard enables you to view the results of the latest security scan for a single website, both while the scan is running and once it has been completed.

Panels in the scan summary dashboard
This section lists and explains the panels in the Scan Summary Dashboard window.
- Activity (default panel)
- HTTP Request/Response
- Knowledge Base Viewer (default panel)
- Attack Radar
- Execute SQL Commands
- Get Shell
- Exploit LFl
- Exploit Short Names
- Controlled Scan
- Logs (default panel)
- Sitemap (default panel)
- Issues (default panel)
- Knowledge Base (default panel)
- Progress (default panel)
- Request Builder
- Encoder
- Invicti Assistant
To set the layout to default, select Reset Layout in the Panels or use the shortcut Ctrl+Shift+R.
Sitemap
The Sitemap panel displays a list of all the directories and files that the scanner crawled.

In this example:
- The directory is auth
- The file is ‘login.php’
- The first vulnerability listed is: ‘Password Transmitted over HTTP’
For further information, see Sitemap Tab.
During a scan, you can view the Activity Status of each file in the Sitemap. Move your pointer over a node and a popup will display information such as ATTACKING, CRAWLED or SCANNED.

For further information, see Sitemap Tab.
Issues
The Issues panel lists all detected vulnerabilities and other issues.

This table describes and explains the icons above the Issues panel. For further information, see Viewing Issues in Invicti Standard and Issues Tab.
Central Panel
The Central Panel displays details about a selected Issue.
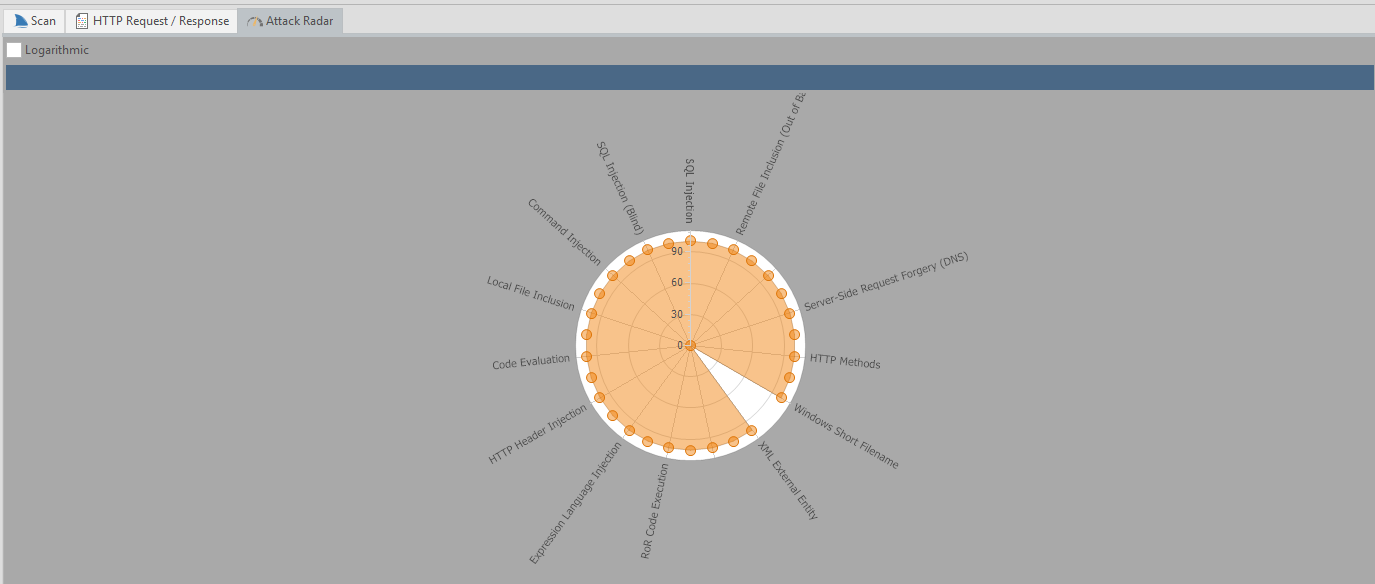
Attack Radar
The Attack Radar displays a circular chart shows the ongoing progress of each security check (SQLi, XSS) during the scanning phase (before most of the SQL Injection attacks have been performed). At the end of the scan, the chart indicates all security checks that have been tested and how many vulnerabilities were found of each type.
Browser View
The Browser View displays the item selected in the Issues panel in a browser. (with JavaScript disabled).
For further information, see How to View an Issue in a Browser in Invicti Standard.
HTTP Request/Response
The HTTP Request/Response displays the request and response of the item selected both in the Issues and Sitemap panel.

For further information, see HTTP Request and How to View the HTTP Request and Response of an Issue in Invicti Standard.
Knowledge Base Viewer
The Knowledge Base Viewer panel displays further details about the item selected in the Knowledge Base panel. It provides a detailed breakdown of the information provided in list form in the Knowledge Base. It also provides search and Save Report functions.

Request Builder
The Request Builder panel enables you to work with HTTP requests so that you can perform the following functions::
- Sending requests to the target
- Modifying imported HTTP requests
- Creating your own HTTP requests
- Analyzing and exploiting vulnerabilities
- Analyzing the HTTP response

For further information, see HTTP Request Builder.
Vulnerability
The Vulnerability panel displays further details about the selected vulnerability, such as:
- Name
- Certainty value
- Classification
- PCI 3.2
- OWASP 2013
- OWASP 2017
- OWASP 2021
- CWE
- CAPEC
- WASC
- HIPAA
- ISO27001
- CVSS 3.0
- CVSS 3.1
- ASVS 4.0
- NIST SP 800-53
- DISA STIG
- Proof of exploit
- Vulnerability details
- Impact
- Actions to take
- Remedy
- Required skills for successful exploitation
- External references
- Remedy references
- Proof of concept notes

Execute SQL Commands
The SQL Exploiter panel enables you to run manual SQL queries in the server to execute code or an SQL command on the target directly. . These SQL queries are executed by the vulnerability URL. The panel updates the URL with a given query and sends it to the server. After obtaining a response, the result of the query is shown inside the panel. This panel is enabled when a selected vulnerability is an exploitable SQL Injection vulnerability.

Get Shell
The Get Shell panel runs OS commands on a shell on the target web application’s server. This panel updates the URL with a given command and sends it to the server. After getting a response, the result of this command is shown inside the panel. The Get Shell panel is enabled when a selected vulnerability is an exploitable Command Injection, Code Evaluation, Code Execution or a similar vulnerability.

Exploit LFl
The Exploit LFl panel reads the contents of files on the target web server by exploiting the Local File Inclusion (LFI) vulnerability detected during scan.

Exploit Short Names
The Short File Names panel defines the path to be exploited and display the results. A short file name is the name of the MS-DOS compatible version of your file that is created by Windows. For example, if you create a backup file with a randomized name that is not supposed to be accessible from outside, such as backup-a8accb12bb74411eb248a1a05b0b0ecb.sql, Windows will create a short file name for this file called BACKUP~1.SQL.
The Short Filename vulnerability allows remote attackers to disclose important file and folder names that are normally not accessible from the outside and gain intelligence about the application infrastructure. This may cause a leakage of files containing sensitive information, such as credentials, configuration files and maintenance scripts.

For further information, see Windows Short Filename.
Controlled Scan
The Controlled Scan panel displays Parameters to Scan and Security Tests, so you can choose to scan a single page or parameter for a specific number of vulnerabilities.

For further information, see Creating a Controlled Scan.
Encoder
The Encoder panel enables you to encode and decode text from and to various formats.

Activity
The Activity panel displays current scan activities. During a scan, the Activity panel provides information about HTTP requests, and which files and parameters are being crawled or scanned in real time.
This table describes and explains the fields in the Activity panel.
| Field | Explanation |
| Method | This is the HTTP request method like GET, POST. |
| Target | This is the URL currently being crawled or scanned. |
| Parameter | This is the URL parameter of the scan. |
| Duration | This is the length of the current operation, attacking or scanning. |
| Current Activity | This is the current executing security check. For example, ShellShock is the 24th of 25 checks in the Command Injection security check group. |
| Overall Activity | This is the current executing security check group. For example, Command Injection is the fourth of 31 groups. |
| Status | This is the current process, such as analyzing, requesting, parsing, and confirming. |

Progress
The Progress panel displays Scan Speed and Scan Progress (from zero to 100%). It also has a Requests per second slider that allows you to adjust the number of requests sent per second by clicking anywhere on the slider.
- The Progress bar estimation calculation is based on engine runtimes, the actual time these requests and analysis of their responses would take, including CPU-intensive DOM simulation operations.
- The Scan Performance section in the Knowledge Base report reflects engine runtimes.
The Progress panel also provides information on:
- Links
- 404 Responses
- Total Requests
- Start (date and time)
- Failed Requests
- Head Requests
- Elapsed (time)
- Estimated (date and time)

Scan Duration and Speed
The duration of a web security scan depends on many factors, such as the size and complexity of the target website, the availability of bandwidth between the scanner and the target, the target’s response time, and the number of security checks for which the target is being scanned.
For further information, see How Fast is Your Web Vulnerability Scanner?.
Reducing the scan duration
There are several improvements you can do to improve the speed of a scan. From Invicti’s end, you can optimize the scan policies also increase the number of concurrent connections the scanner opens during a scan.
By default, Invicti Standard will open up to 12 concurrent connections during a scan. By increasing the number of concurrent connections, you will increase the load on the target server. Ensure the server can handle the load before increasing the number of concurrent connections. More concurrent connection does not always yield a higher speed scan. For example, if the target server cannot handle the load, the scan can be slower.
For further information, see Scan policy Optimizer and How Can You Improve the Scan Results?.
Logs
The Logs panel displays a list of all scanner actions that have taken place during the Scan and confirms detected logouts. It also notifies users of login failures due to changed credentials.

Knowledge Base
The Knowledge Base panel displays a list of additional information about the Scan, and is sorted into groups. Click on each one to view its details displayed in the Central Panel.

For further information, see Knowledge Base Tab.
Knowledge Base Nodes
For further information on the Knowledge Base nodes in the Knowledge Base panel, see Knowledge Base Nodes.
Invicti Assistant
Invicti Assistant is a smart scan assistant that guides you through a scan, detecting and displaying details of scan configuration anomalies, and enabling you to change and optimize the current configuration. The Invicti Assistant panel is displayed on the Invicti Standard window along with the Knowledge Base.

You can switch between viewing the Knowledge Base and Invicti Assistant panels by clicking the relevant tab.

For further information, see Invicti Assistant.
How to view the scan summary dashboard in Invicti Standard
- Open Invicti Standard.
- Load a previous scan or launch a new scan.
- Click the View tab. The Dashboard is displayed, showing the default panels: Sitemap, Dashboard, the Central Panel, Logs, Issues and Knowledge Base.
For further information, see Panels in the Scan Summary Dashboard.
What’s New
In both editions, a What’s New panel is displayed on the right hand side of the window. The contents of this popup are populated from those blog posts on the Invicti website that provide information about new updates, releases, and features.
In Invicti Enterprise, the What’s New panel is displayed as illustrated. For information on how to show or hide this panel in Invicti Enterprise, see What’s New.

In Invicti Standard, the What’s New panel is displayed as illustrated.

The What’s New popup is displayed when there is a new post added. You can also display and hide it by clicking the What’s New icon on the Help tab.